


マップボックスで本屋で目にする国土地理院の地図を作ってみました。
<!DOCTYPE html>
<html>
<head>
<meta charset=utf-8 />
<title>A simple map</title>
<meta name='viewport' content='initial-scale=1,maximum-scale=1,user-scalable=no' />
<script src='https://api.mapbox.com/mapbox.js/v3.1.1/mapbox.js'></script>
<link href='https://api.mapbox.com/mapbox.js/v3.1.1/mapbox.css' rel='stylesheet' />
<style>
body { margin:0; padding:0; }
#map { position:absolute; top:0; bottom:0; width:100%; }
</style>
</head>
<body>
<div id='map'></div>
<div id="map">
<link rel="stylesheet" href="http://cdn.leafletjs.com/leaflet-0.7.3/leaflet.css" />
<script src="http://cdn.leafletjs.com/leaflet-0.7.3/leaflet.js"></script>
<script>
var map = L.map('map');

L.tileLayer('http://cyberjapandata.gsi.go.jp/xyz/pale/{z}/{x}/{y}.png', {
attribution: "<a href='http://portal.cyberjapan.jp/help/termsofuse.html' target='_blank'>国土地理院</a>"
}).addTo(map);

var office = L.marker([35.6614,139.7543]).addTo(map);
office.bindPopup("DTS CORPORATION HQ").openPopup();

map.setView([35.3622222, 138.7313889], 15);

map.on('click', function(e) {
var latitude = (Math.round(e.latlng.lat * 10000)) /10000;
var longitude = (Math.round(e.latlng.lng * 10000)) /10000;
alert("緯度:" + latitude + " , " + "経度:" + longitude);
});
</script>
</div></body>
</html>
マップはこんな感じです。
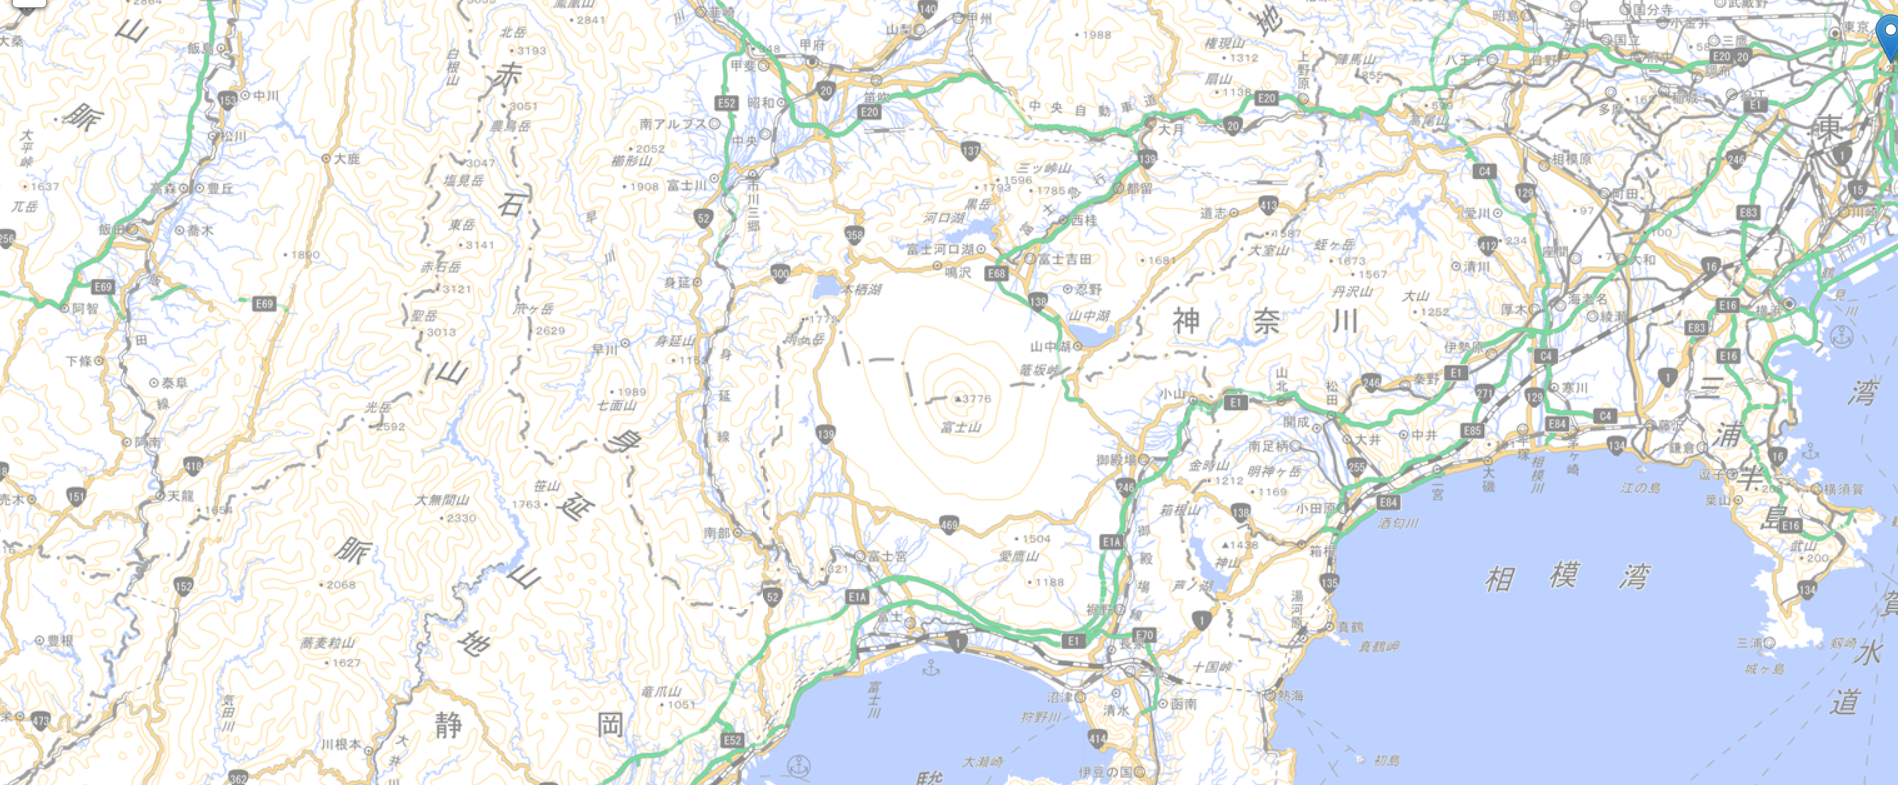
地図の見た目を変えるだけでなく、人や車の動きも再現できる柔軟性はさすがですね。